General News
We look forward to fun next with POP, talent shown, and graduation!
ELA
This week we discussed our final chapter in a Rover’s Story and completed our check-in on the book with a few multiple choice, short answer, and long answer questions. This was a good chance to also check in about writing in more formal, complete sentences – which was a big part of our P&P this quarter. After we did our check-in we had time to finish up our Rover’s Story comics. We also wrote interview questions for Resilience and acted them out together. Everyone got to ask their interview questions while others volunteered to improve Resilience’s responses. This was a fun and creative activity and also a great way to check for deep comprehension of character study!
Math
This week, both groups of Deltas studied data analysis, compiling reports containing charts and graphs that visualize data in different ways. Like the Delta 2s the week prior, The Delta 1s acted as if they were a data science team with the City of Austin, and gathered data about dogs in the animal shelter. They then used the data to create frequency tables, dot plots, scatterplots, and stem-and-leaf plots. We also practiced reading and analyzing tables and graphs created around different sets of data and found time to practice metric conversions and review the attributes of the coordinate plane. We wrapped up our week with a check-in about the skills learned during the 4th quarter.
The Delta 2s also learned about different ways to visualize data. We took a deeper dive into dot plots, looking at the shape of data (whether it is symmetric, skewed left, or skewed right). We defined the mode of a dataset to be the value that occurs most frequently, and had a lot of fun learning a song to help us remember the definitions of mode, mean, and median (ask your Delta to sing it for you!). We also answered the question of what to do when there are too many unique values to make a dot plot: we make a histogram! To make a histogram, we group numerical data into intervals and show frequency using bars (like in a bar graph). Histograms still allow us to view the shape of the data, while consolidating the data into something manageable. Finally, we used what we learned last week about quartiles to create box-and-whisker plots, and ended our week with a check-in as well.
Theme
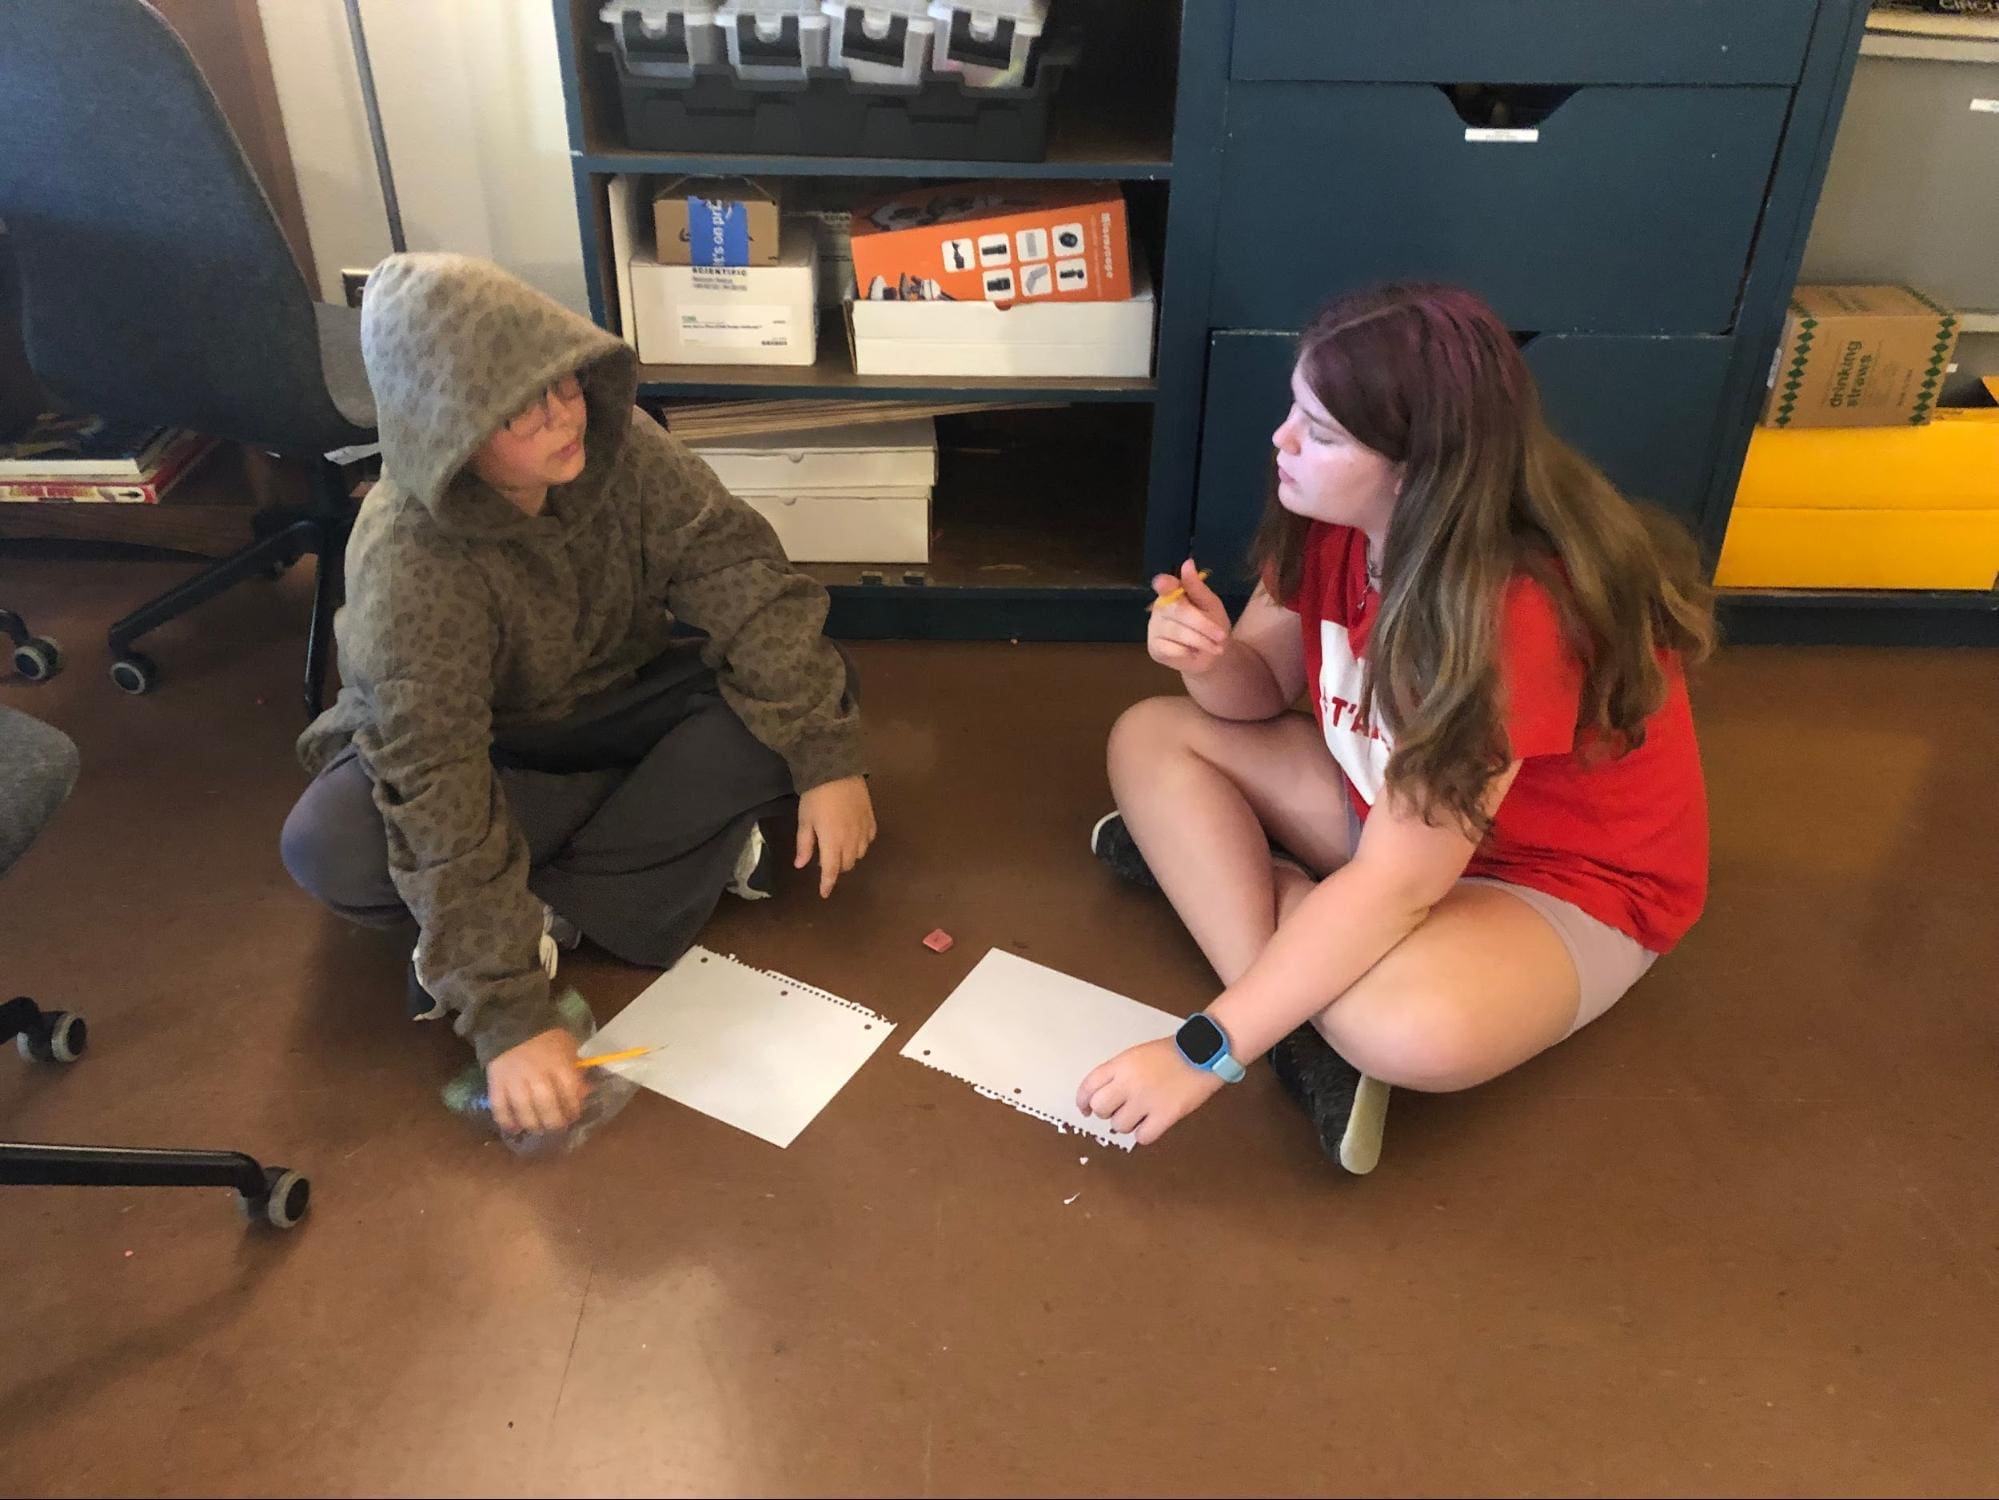
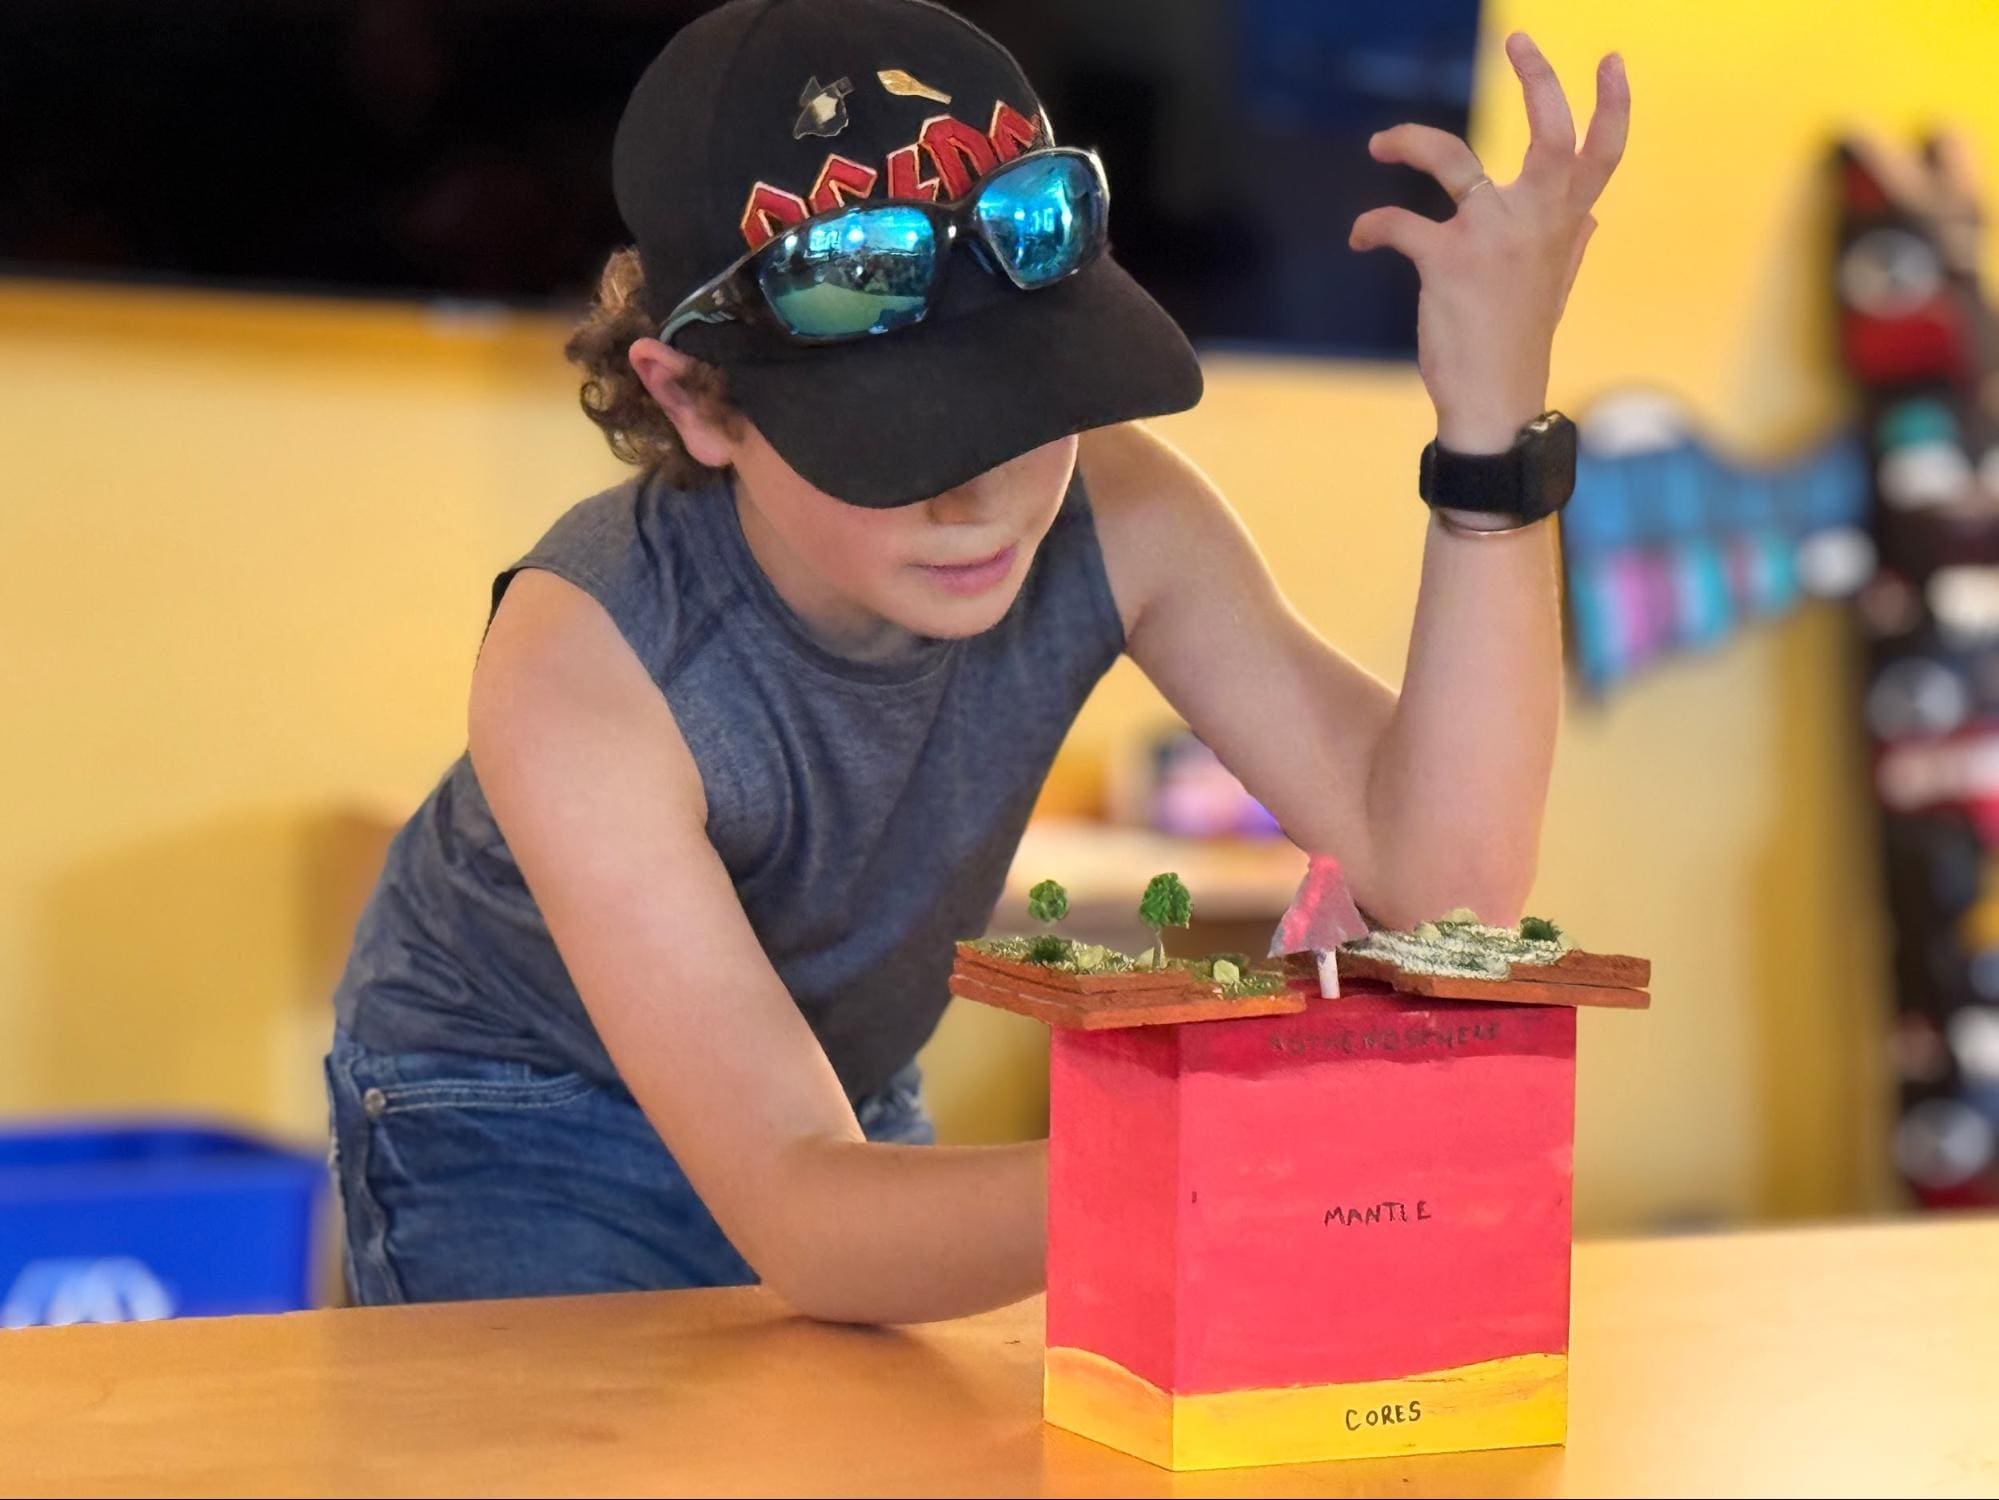
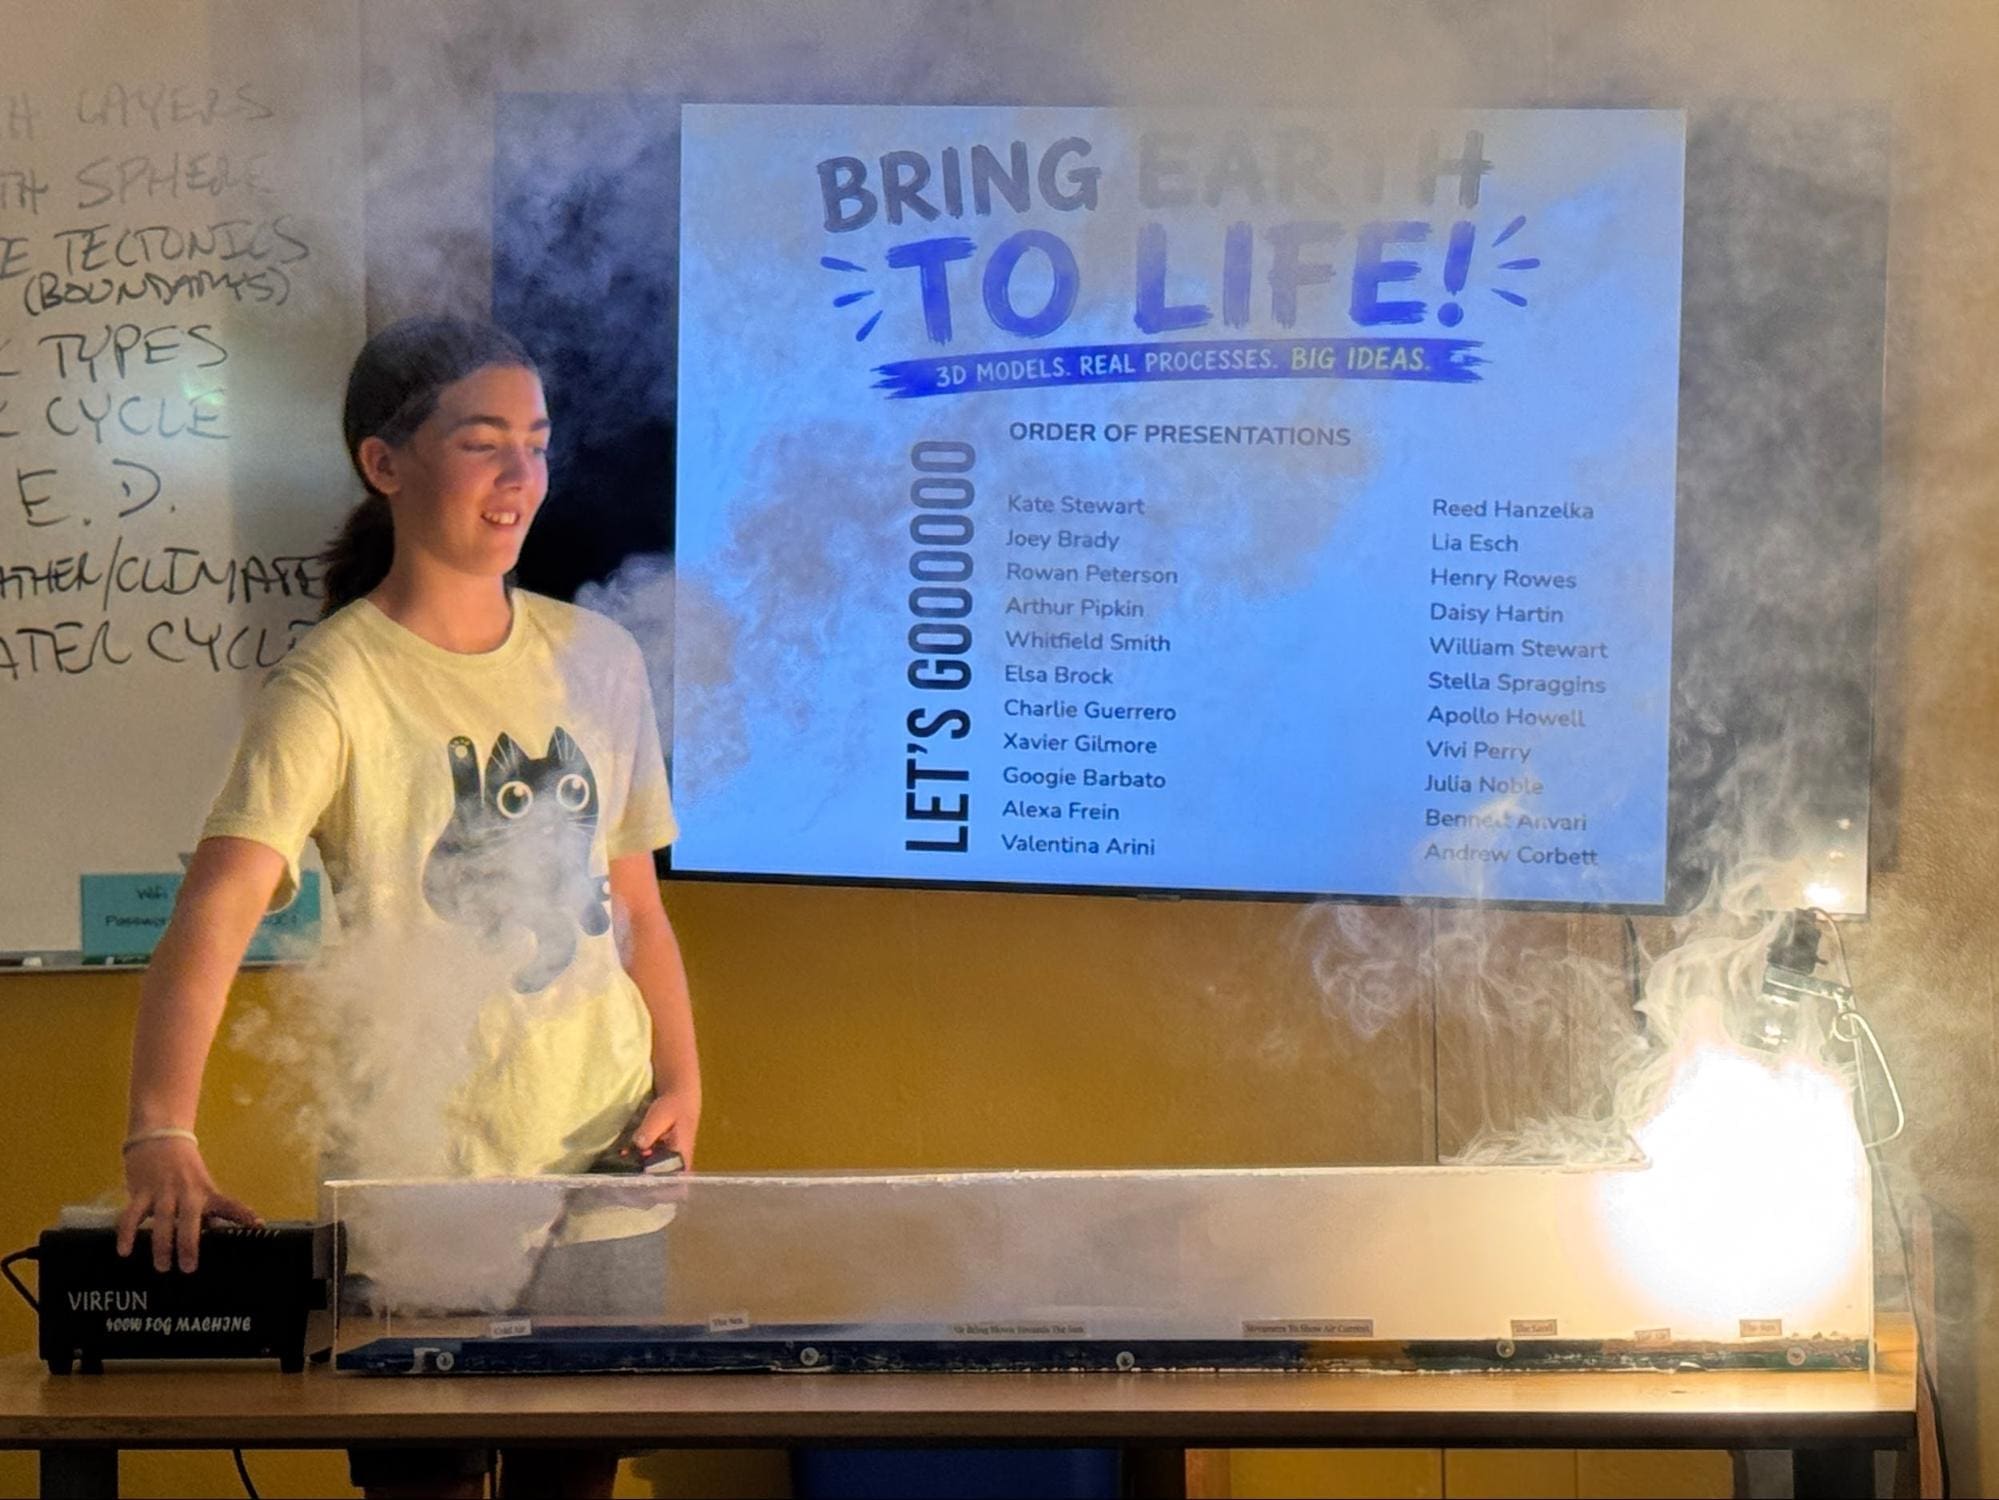
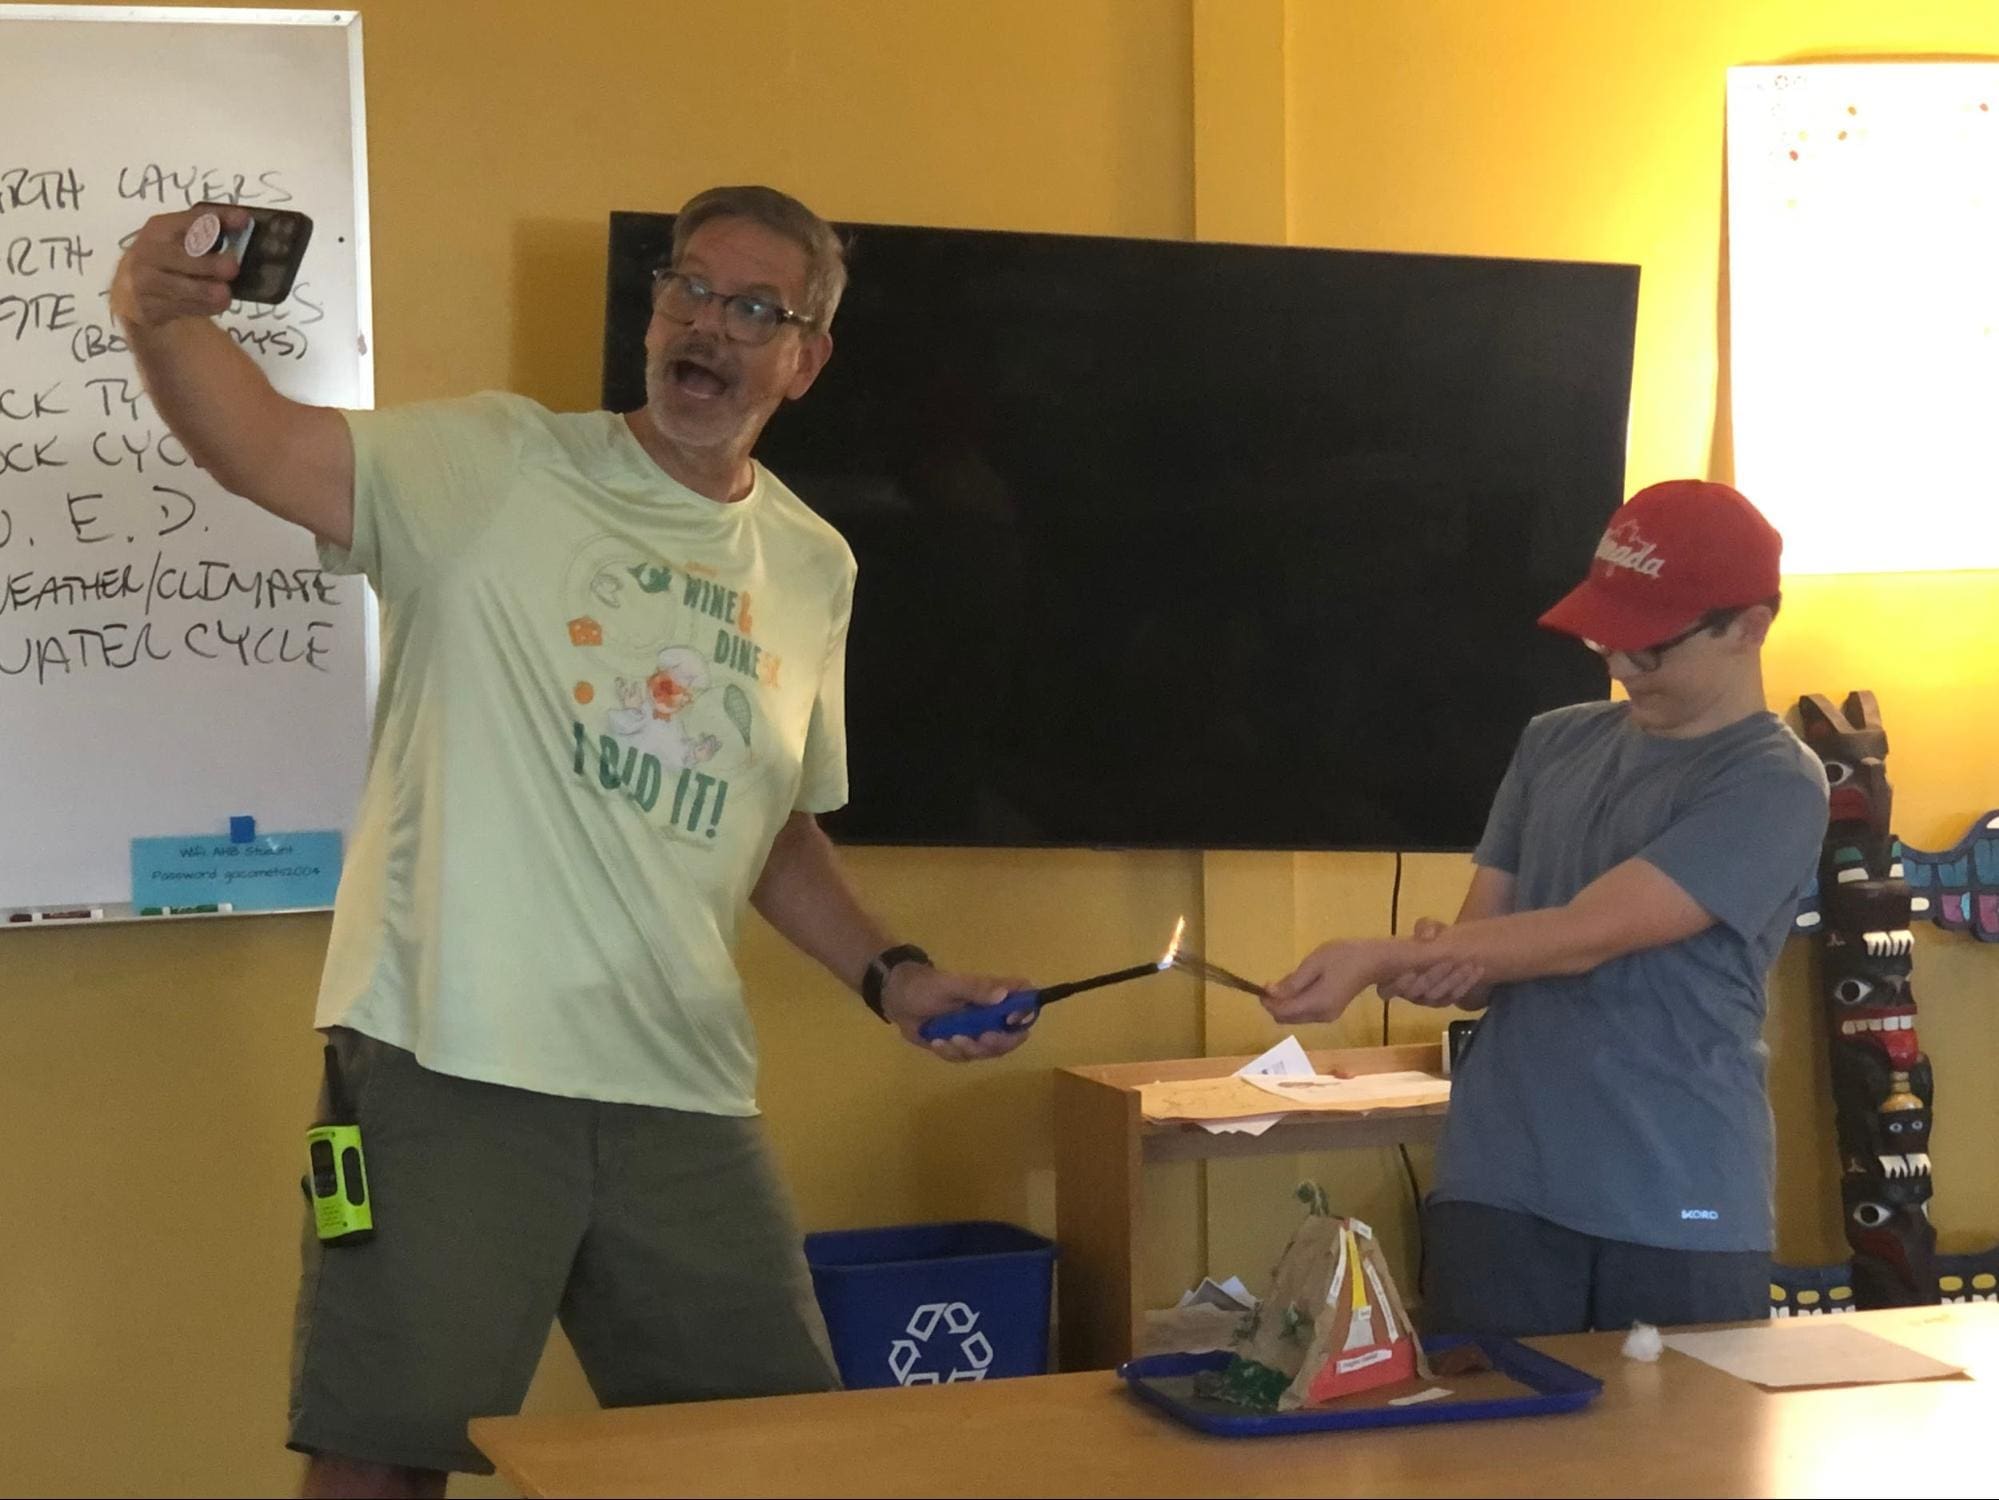
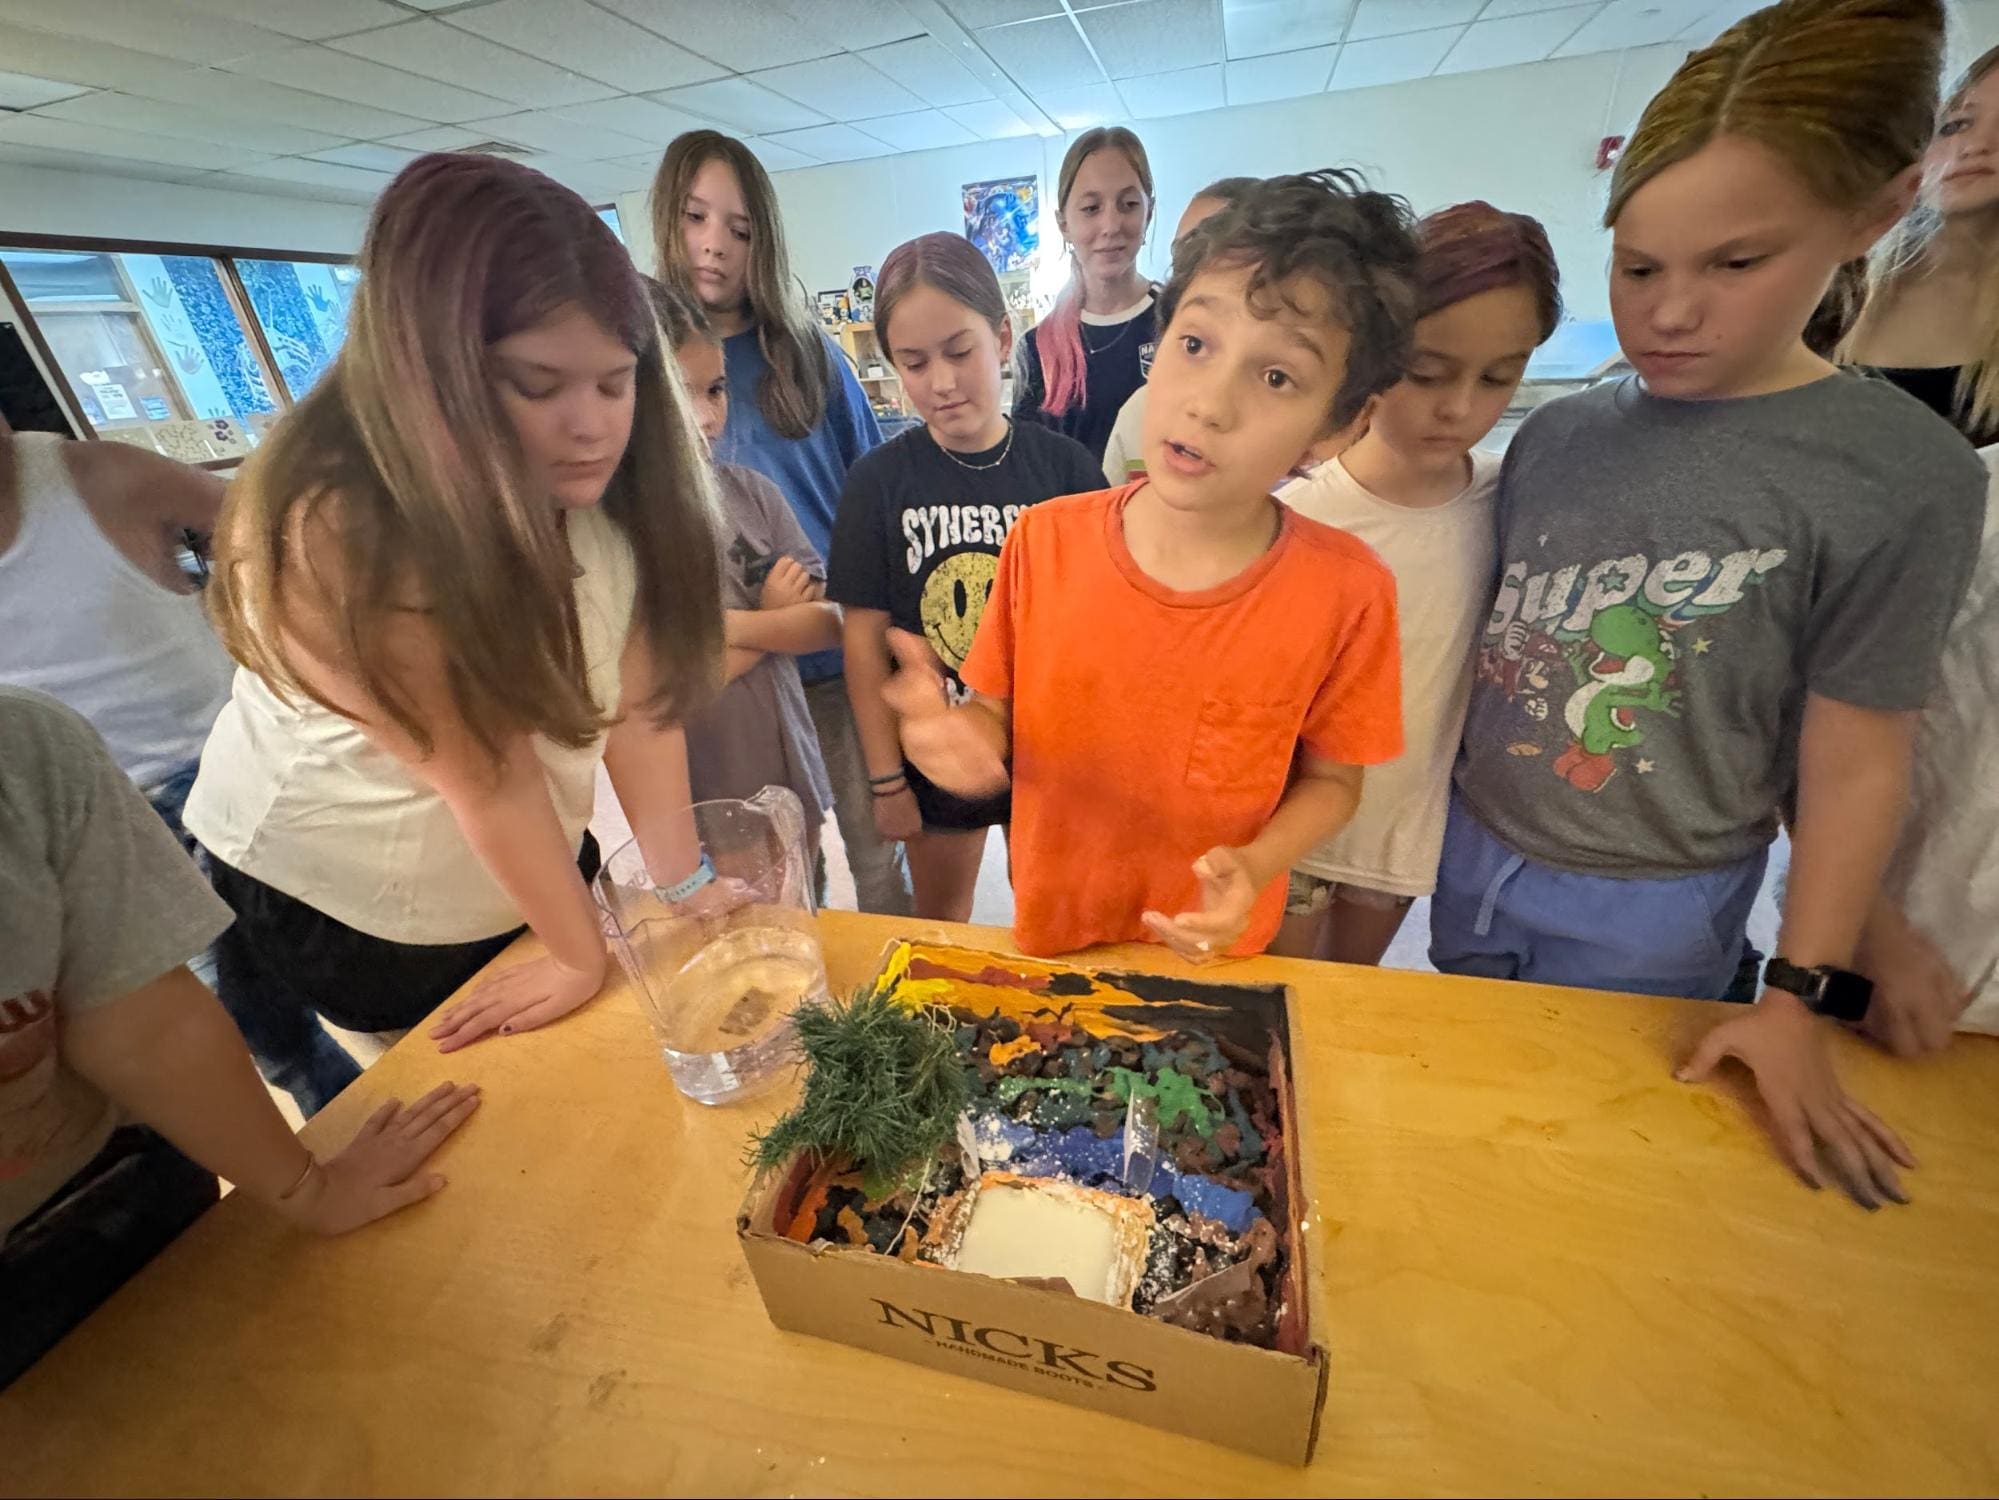
Theme students proudly presented their quarter projects focusing on a variety of Earth Science processes. The classroom was transformed into an interactive showcase of creativity and scientific understanding as students explained models, demonstrations, and displays covering topics from photosynthesis and erosion to forest fires and coral reef development. Each project highlighted how natural processes shape Earth’s systems and ecosystems while encouraging students to connect scientific concepts to real-world examples.
The presentations were both informative and entertaining, featuring impressive hands-on elements that brought the projects to life. Some groups demonstrated erosion using flowing water models that splashed across miniature landscapes, while others recreated forest fire conditions using safe theatrical smoke effects to show how fires spread and impact environments. Coral reef projects displayed colorful underwater ecosystems and explained the importance of biodiversity and ocean conservation. Students showed excellent creativity, collaboration, and communication skills as they shared their research and answered questions from classmates and teachers.
Students will wrap up the unit by taking their final Check In evaluation on Monday. The assessment will give students an opportunity to demonstrate their understanding of the Earth Science concepts explored throughout the quarter, including Earth processes, ecosystems, weathering and erosion, and the interactions between Earth’s systems.
| 
|  |
|  | 
|
|